
Monitorizare proactivă, nu reactivă
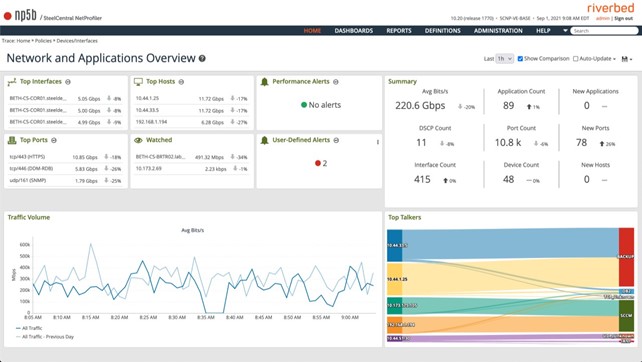
În prezent, performanța rețelei este indisolubil legată de performanța afacerii. Departamentul de operațiuni IT trebuie să înțeleagă modul în care performanța degradată și incidentele de securitate afectează utilizatorii finali și, în cele din urmă, afacerea. NetProfiler este un analizor NetFlow care utilizează analiza comportamentală pentru a stabili o linie de bază a comportamentelor normale ale rețelei, apoi alertează asupra schimbărilor care ar putea afecta experiența utilizatorilor sau indica o încălcare a securității.

Simplificați migrările
Migrarea aplicațiilor în cloud poate fi complexă și poate consuma mult timp. NetProfiler automatizează cartografierea tranzacțiilor aplicațiilor cu infrastructura lor de bază, astfel încât definițiile aplicațiilor și interdependențele lor să fie ușor de identificat și precise. Acest lucru simplifică o gamă întreagă de inițiative de schimbare IT, inclusiv migrațiile în cloud.
Planificați în mod corespunzător schimbările de capacitate
Este esențial să se asigure că rețelele dispun de resurse adecvate pentru a face față nevoilor actuale și viitoare de lățime de bandă. Cu ajutorul monitorizării traficului de rețea Alluvio NetProfiler, puteți obține informații despre capacitatea, utilizarea, performanța și compoziția traficului din rețea pentru a asigura livrarea de aplicații de înaltă performanță. Înțelegeți modul în care fluxurile de trafic din rețea se modifică în timp pentru a preveni surprizele nedorite care ar putea afecta utilizatorii.

Vizibilitate hibridă și multi-cloud
Obțineți aceeași monitorizare a traficului de rețea ușor de utilizat în mediile on-prem, virtuale și multi-cloud. Simplificați depanarea hibridă și reduceți punctele moarte ale rețelei și aplicațiilor cu până la 53%.