Riverbed® NetProfiler provides network flow analytics that you can use to quickly diagnose network problems and identify security threats before end users realize there’s a problem.
Riverbed NetProfiler combines network flow data with packet-based flow metrics to provide proactive monitoring, analysis, and reporting. Use NetProfiler to answer questions such as: how much traffic do I have, who’s using it, where is it going, and how is it prioritized?
OPPORTUNITIES
IT organizations need to understand how degraded performance affects network and application performance and ultimately business performance. NetProfiler uses behavioral analytics for proactive monitoring. It establishes a baseline for normal performance and alerts on changes as soon as they occur – usually before users realize that performance is degrading.
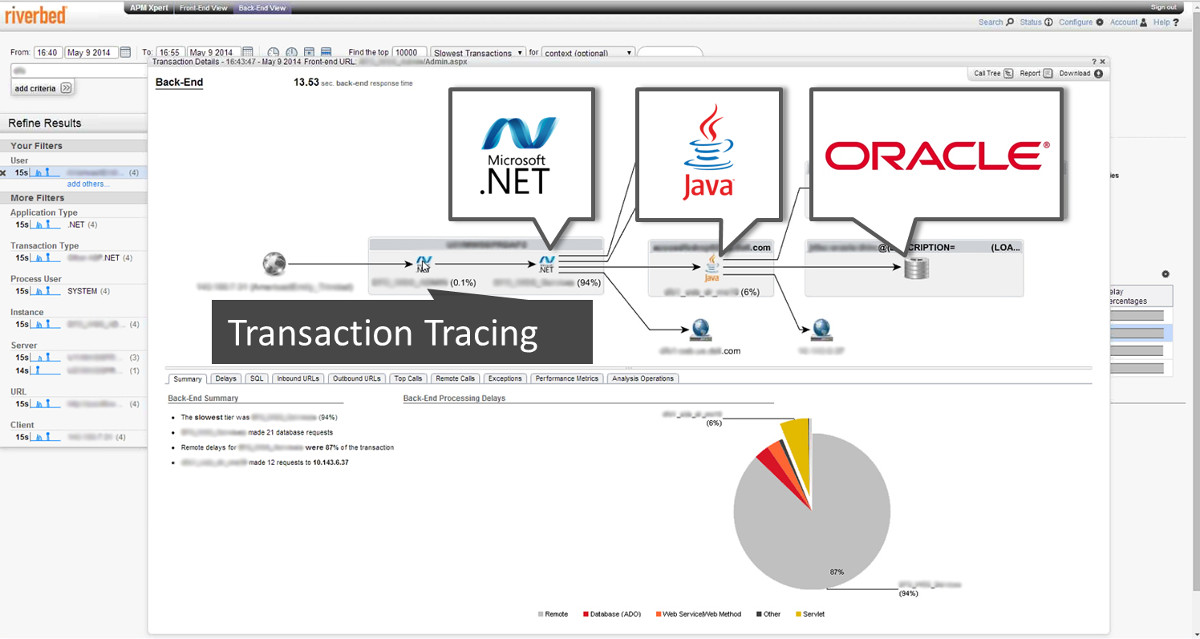
NetProfiler automates the mapping of application transactions to their underlying infrastructure so that application definitions and interdependencies are accurate. This helps you create service maps that accelerate the identification of problems in complex application ecosystems and plan data center consolidation, cloud, disaster recovery, or virtualization initiatives.
Deploy anywhere and everywhere you need for on-premises, virtual or cloud visibility. NetProfiler is designed to meet your hybrid and cloud needs, and is compatible with both Azure NSG and AWS VPC Azure stream logs.
NetProfiler Advanced Security Module optional security analysis software. It leverages streaming data to detect, investigate and mitigate advanced threats. NetProfiler Advanced Security Module is particularly suited for threat hunting, incident response and network forensics.
Key benefits

Benefits of network traffic monitoring

Proactive, not reactive monitoring
Today, network performance is inextricably linked to business performance. IT Operations must understand how degraded performance and security incidents affect end users and ultimately the business. NetProfiler is a NetFlow analyzer that uses behavioral analytics to establish a baseline of normal network behaviors, then alerts on changes that could affect the user experience or indicate a security breach.

Simplify migrations
Migrating applications to the cloud can be complex and time-consuming. NetProfiler automates the mapping of application transactions to their underlying infrastructure so that application definitions and their interdependencies are easily identifiable and accurate. This simplifies a whole range of IT change initiatives, including cloud migrations.

Plan capacity changes properly
Este esențial să se asigure că rețelele dispun de resurse adecvate pentru a face față nevoilor actuale și viitoare de lățime de bandă. Cu ajutorul monitorizării traficului de rețea Alluvio NetProfiler, puteți obține informații despre capacitatea, utilizarea, performanța și compoziția traficului din rețea pentru a asigura livrarea de aplicații de înaltă performanță. Înțelegeți modul în care fluxurile de trafic din rețea se modifică în timp pentru a preveni surprizele nedorite care ar putea afecta utilizatorii.

Hybrid and multi-cloud visibility
Get the same easy-to-use network traffic monitoring across on-prem, virtual and multi-cloud environments. Simplify hybrid troubleshooting and reduce network and application blind spots by up to 53%.
NETPROFILER RIVERBED INTERFACE


CYBERSECURITY
NetProfiler captures full-resolution network data – flow records (NetFlow, sFlow, IPFIX, etc.) and performance measurements – across all internal network paths and in the cloud
Uses basic statistics and proactive monitoring to trigger an alert once a deviation is detected, without prior knowledge of specific applications, route dependencies and number of users
Ensure the success of your SteelConnect SD-WAN environment by validating policies that perform as expected, resolving issues quickly, and planning better.
– NetProfiler offers three ways to create a customized application definition. You can map:
– Hosts, groups of hosts, protocols, ports to an application name.
– Automatically recognized applications on an application name
– URLs to an application name
– Deep packet packet inspection of application traffic from Riverbed® AppResponse, Riverbed® NetShark, and SteelHead for easy visualization and analysis in the NetProfiler dashboard to help you quickly and accurately distinguish business-critical applications from recreational applications running across your entire network, including WAN optimized
– Includes a discovery wizard that creates application dashboards to automate the process of mapping transactions to their underlying infrastructure so that application definitions and interdependencies are accurate – including discovery through F5, Riverbed® SteelApp™ Traffic Manager and other application delivery controllers (ADCs).
– Create service maps to accelerate troubleshooting in complex application ecosystems and plan for data center consolidation or cloud consolidation, disaster recovery, and virtualization initiatives WAN optimization analysis
– Robust analysis of optimized Riverbed SteelHead and Interceptor environments enables you to easily plan your optimization deployments, assess the impact, and quantify the benefits
– Cost-effectively troubleshoot branch issues using a single product for visibility, control, and optimization
– Centralized reporting and monitoring of inbound and outbound Quality of Service (QoS) and Quality of Service (QoS) classes
– Rich monitoring of over 2000 default and customer-defined applications
– Monitor all network and infrastructure components involved in providing an application service, such as users, Web servers, load balancers, application servers, authentication and DNS servers, databases, and the links between them.
– Advanced analysis of performance changes, providing proactive notification of brewing problems
– Service dashboards provide a quick view of the end-to-end health of a business service, which is presented visually through red-yellow-green health indicators
– A guided drill-down reveals details about the most critical applications year
One-click dashboard creation creates NetOps-centric, application-specific, SteelHead WAN optimization-specific, and VoIP-related SteelHead WAN optimization dashboards that quickly highlight relevant data and streamline troubleshooting workflows.
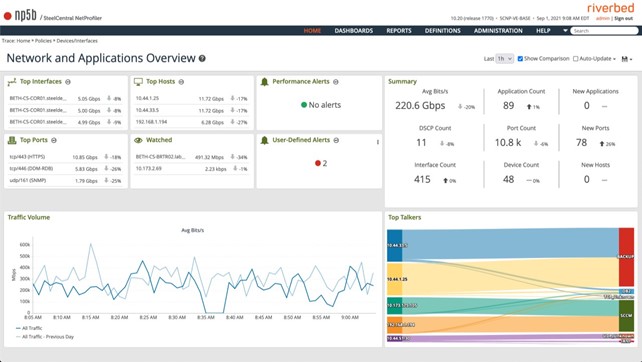
It provides an instant summary of the main network and application KPIs and how they’ve changed; lists of recent performance and security alerts; “Top Talkers sankey” chart; overall traffic charts; and a watchlist so you can monitor what’s important to you.
The NSX-compliant IPFIX format enables Riverbed NPM products to provide detailed information about which NSX virtual overlay networks are running on the physical network, which applications are involved, and which hosts and virtual tunnel endpoints are generating traffic.
– NetProfiler can be deployed in
– AWS
– AWS GovCloud West
– Azure
– Azure Government (non-DoD, no Iowa)
The following stream telementeria can generate and send cloud streams to NetProfiler in the cloud or on-prem.
– AppResponse Cloud
– AWS VPC Flow Logs
– Azure NSG flow logs
– Other external/cloud solutions that can generate and send streams in standard format (e.g. NFv5, v9, IPFIX, etc.) will also work.
– Blacklists alert on known IP addresses, CIDRs, etc. that have been previously identified as being associated with malicious activity.
– Threat feeds are analyst-generated information about potential threats. Threat feeds allow you to read more and investigate your network
– Accurately detect volumetric, protocol and application DDoS attacks in just 10 seconds.
– Take immediate action to surgically redirect traffic to A10 TPS mitigation centers or Verisign CloudSign cloud cleanup centers
NetProfiler captures and stores all streams, so you have complete fidelity forensic analysis for threat hunting. Pivot and drill down to follow every clue, and the data will always be there
Have the data you need to recover from a cyber incident quickly and accurately to minimize business disruption
Security analysis
Understand changing patterns of behavior on your network that indicate security threats:
- Suspect connection: when two hosts that don’t normally communicate start talking.
- Worm: a pattern of scanning between hosts, where previously scanned systems suddenly become scanners themselves. Identification of patient zero, infected hosts and means of propagation are reported
- New host: a previously unidentified host has sent enough traffic to be considered as having joined the network.
- New Service: a host or an automated group of hosts provides or uses a service on a new port.
- Host Scan: A series of hosts are polled on the same port.
- Port scan: a host or a series of hosts is queried on a series of ports.
- Bandwidth surge: a significant increase in traffic that corresponds to the characteristics of a DoS or DDoS attack.
Got questions? Ask a Xontech Systems expert

